
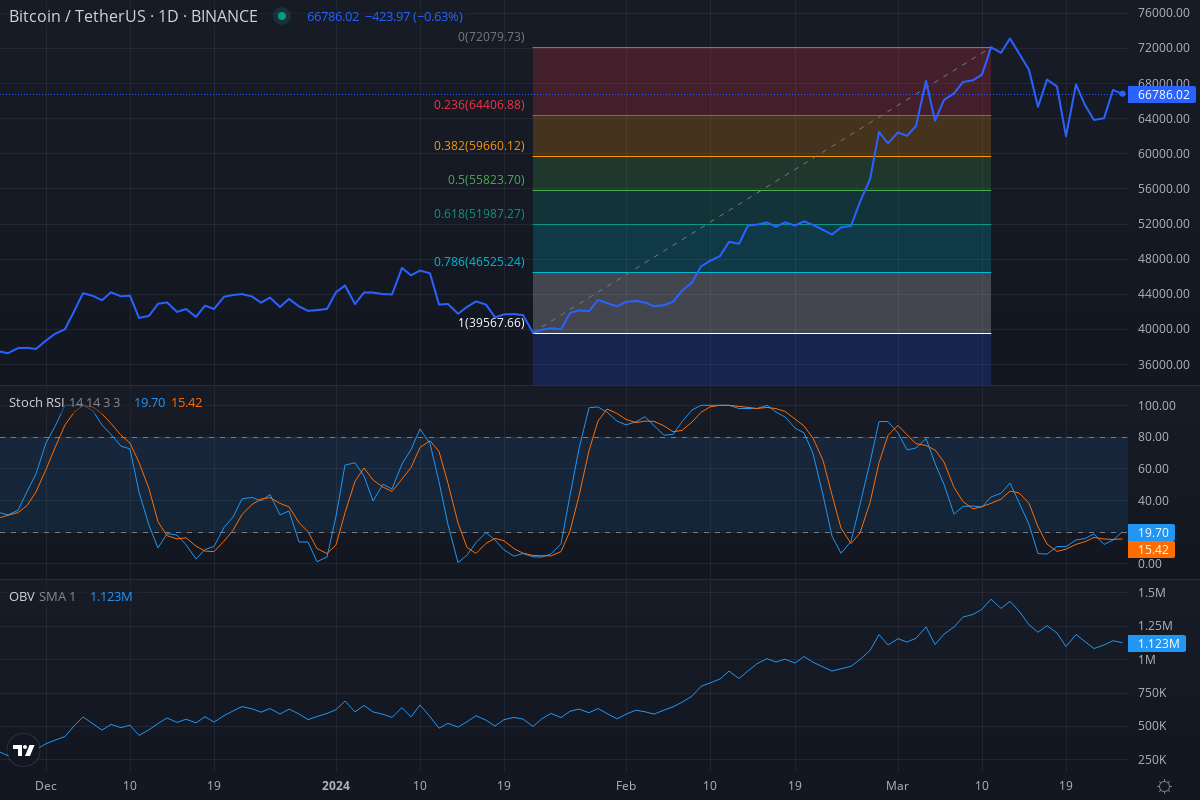
Bitcoin’s price action over the last 120 days has been a rollercoaster ride for investors. Starting around $37,000 in late November 2023, the price rallied strongly, nearly doubling to reach a high around $73,000 in early February 2024. However, after this impressive run, the price began to lose steam, retracing to around $50,000 by late February before attempting another rally to retest the highs in early March. Interestingly, this second high was slightly lower, forming a potential double top pattern that often precedes a trend reversal. Since that second peak, Bitcoin has been trending down, falling to around $66,000 by late March 2024, a decline of about 10% from the highs. The Stochastic RSI, which spent much of December and January in overbought territory above 80 as the price rallied, has since fallen, ending the period at 19.84 and suggesting waning bullish momentum.
Summary:
Bitcoin’s price experienced a rollercoaster ride over the past 120 days, rallying from around $37,000 to nearly $73,000 before retracing to around $66,000 by late March 2024. The OBV indicator suggests underlying buying pressure remains intact, despite the recent pullback. Key Fibonacci retracement levels to watch are $64,400 (0.236) and $59,500 (0.382) from the November-February rally. In the short-term, a break above $67,209 could signal continued bullish momentum, while a decline below $64,446 (61.8% Fibonacci) may indicate a deeper correction. Overall, the technical picture remains bullish if Bitcoin holds above key support levels.
Bitcoin’s price action over the last 120 days has been a rollercoaster ride for investors. Starting around $37,000 in late November 2023, the price rallied strongly, nearly doubling to reach a high around $73,000 in early February 2024. However, after this impressive run, the price began to lose steam, retracing to around $50,000 by late February before attempting another rally to retest the highs in early March. Interestingly, this second high was slightly lower, forming a potential double top pattern that often precedes a trend reversal.
Since that second peak, Bitcoin has been trending down, falling to around $66,000 by late March 2024, a decline of about 10% from the highs. The Stochastic RSI, which spent much of December and January in overbought territory above 80 as the price rallied, has since fallen, ending the period at 19.84 and suggesting waning bullish momentum.
Notably, the OBV indicator, which rose steadily from November to February and confirmed the bullish price action, has not turned down significantly with the recent price declines. This suggests that the underlying buying pressure may still be intact, and buyers could step in to support the price.
Looking at the Fibonacci retracement levels drawn from the November low to February high, the price bounced right at the 0.382 retracement level around $59,500 in late February and is currently testing the 0.236 level around $64,400. A decisive break below this level would suggest a deeper pullback is likely, with the next support at the 0.382 level again.
Zooming into the last 40 days from February 15th to March 25th, 2024, we see Bitcoin started around $51,880 and trended mostly sideways until February 26th. From there, the price broke out sharply to the upside, rallying over 40% to a high of $73,074 by March 13th. However, the price then reversed course and declined back to around $66,859 by the end of the period.
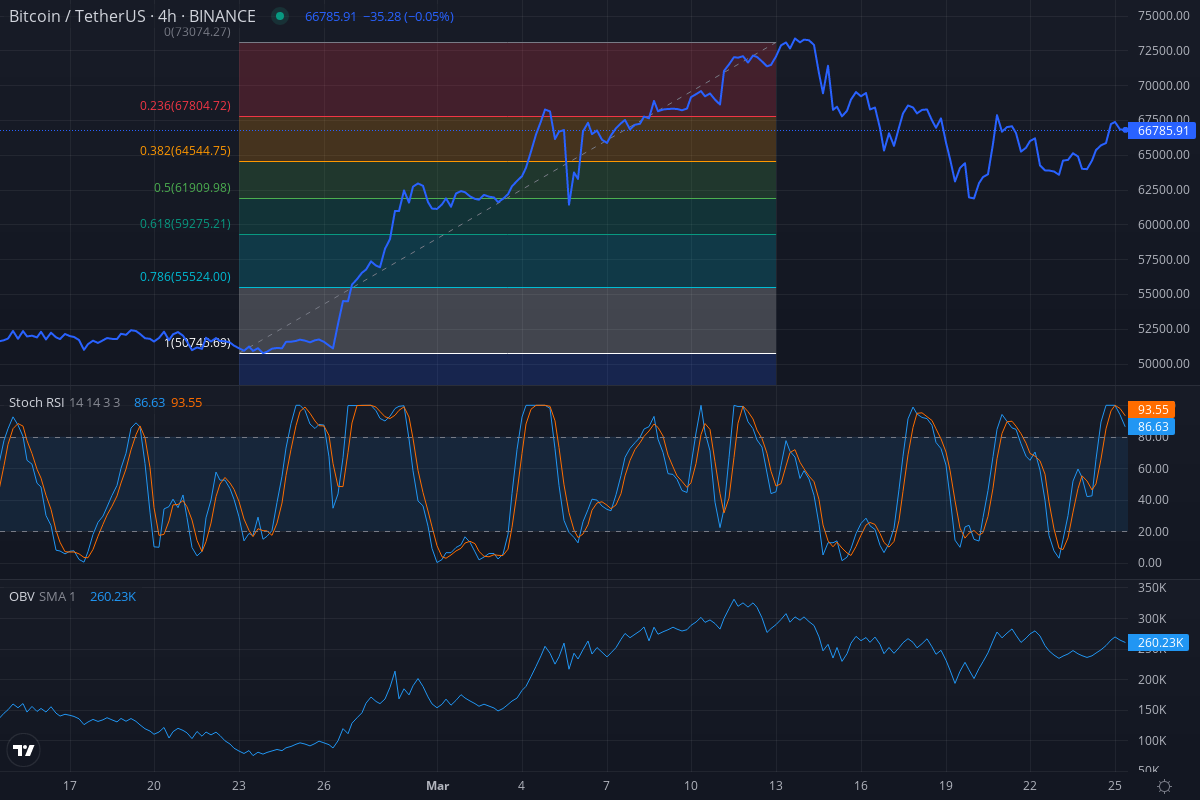
Interestingly, the OBV indicator showed very strong positive divergence from the price during the February consolidation phase, foreshadowing the major rally that followed. OBV continued making new highs even as the price advance stalled in mid-March, indicating underlying buying pressure remained intact. This bullish OBV divergence suggests the pullback may prove to be a healthy correction and consolidation within a larger uptrend.
The Fibonacci retracement levels drawn from the rally from $50,745 to $73,074 show the pullback retraced about 50% of that up move, finding support right around the key 0.5 Fibonacci level near $62,000. Holding above this level keeps the overall technical picture bullish.
Finally, looking at the most recent 3-day period from March 22nd to March 25th, 2024, we see Bitcoin’s price started at $64,261.40 and initially trended downwards before recovering. It then moved higher, reaching $65,659.80, with the Stochastic RSI moving into overbought territory. However, a sharp reversal followed, with the price declining to a low of $63,991.50.
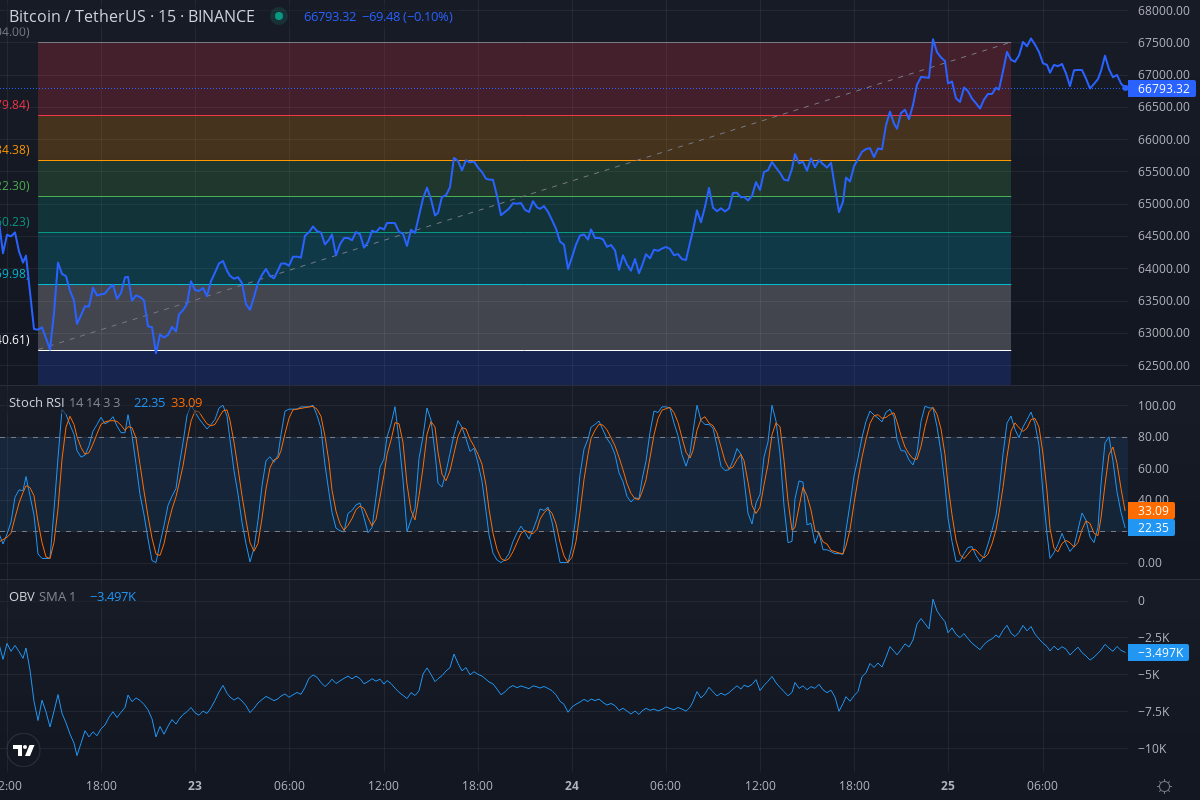
The price then bounced and trended higher again, peaking at $67,209.80 before pulling back slightly. Throughout this period, the OBV indicator initially declined but then started rising, suggesting increasing buying volume supporting the upward price movement.
Key Fibonacci retracement levels to watch based on the move from the $62,740.60 low to the $67,209.80 high are $66,154.21 (23.6%), $65,503.42 (38.2%), $64,975.20 (50%), and $64,446.98 (61.8%).
In conclusion, while the strong uptrend from November to February was very bullish, the recent price action suggests the rally may be losing steam. However, the still strong OBV line suggests that buyers may step in to support the price. If Bitcoin can hold above the key Fibonacci levels, the medium-term uptrend could still be intact for a potential move higher. But a decisive break below these levels would open the door to a deeper pullback.
In the short-term, traders should watch for a sustained break above the March 24th high at $67,209.80 for confirmation of continued bullish momentum, or a decline below the 61.8% Fibonacci level at $64,446.98, which would suggest a deeper correction is unfolding. The 50% retracement level at $64,975.20 is a key pivot point to watch. As always, investors and traders should use a combination of technical and fundamental analysis and employ proper risk management strategies when making investment decisions.
After graduating with an Accounting and Finance degree, Louis decided to combine his passion for Crypto and Writing, moving away from the path he expected to follow after graduating from University.
Full Bio
Solana (SOL) has been on a rollercoaster ride over the past few months, with the cryptocurrency experiencing significant volatility and price swings. Starting with the 120-day period from November 27th, 2023 to March 25th, 2024, SOL kicked off at $55.05 and embarked on a steady climb, reaching a local high of $120.90 on December 25th. […]
Nov 27, 2025
Ethereum (ETH) has been on a rollercoaster ride over the past few months, with the cryptocurrency experiencing significant volatility across different time frames. Looking at the 120-day chart, we can see that ETH has been in a strong uptrend since late November 2023, with the price more than doubling from $2,027.58 to a high of […]
Mar 25, 2024
Bitcoin’s price action over the last 120 days has been a rollercoaster ride for investors. Starting around $37,000 in late November 2023, the price rallied strongly, nearly doubling to reach a high around $73,000 in early February 2024. However, after this impressive run, the price began to lose steam, retracing to around $50,000 by late […]
Mar 25, 2024
In the last few months, Solana (SOL) has demonstrated a volatile yet upward trajectory, breaking through resistance levels and occasionally falling back to test support within designated ranges. Notably, the asset showcased significant price movements and trading volumes, indicating strong buying and selling pressures at various points. The recent analysis reveals a bullish momentum, with […]
Feb 29, 2024
In the ever-evolving landscape of cryptocurrency markets, Ripple (XRP) has showcased a remarkable journey of resilience amidst volatility. Over the last 120 days, Ripple’s price has navigated through significant fluctuations, breaking above resistance levels and dipping below support levels, with trading volumes closely mirroring these pivotal movements. The recent analysis reveals a dynamic interplay between […]
Feb 29, 2024
In a remarkable journey over the last 120 days, Ethereum has showcased a bullish trend, breaking through multiple resistance levels with significant volume spikes. The recent analysis reveals Ethereum’s dynamic price movements, from struggling below the green range to soaring above the orange range, marking a peak at $3374.17. This upward trajectory is supported by […]
Feb 29, 2024
in the latest price analysis, Bitcoin (BTC) has shown an impressive surge, breaking through multiple resistance levels with significant trading volumes backing each move. Starting from a modest $35,421.4 in November 2023, BTC has climbed to a staggering $63,690.1 by February 2024. This journey was marked by a series of bullish breakouts, each supported by […]
Feb 29, 2024
Over the past 120 days, Bitcoin has shown remarkable volatility and resilience, climbing from $34,000 to over $52,000, supported by bullish moving averages.
Feb 26, 2024
Key Points: Strengthened dollar and high U.S. inflation fears prompt oil price decline, complicating rate cut expectations. Natural Gas surges 5.65% to $1.7760, bullish above pivot point $1.7333, with resistance up to $1.9291. UK Oil dips to $81.30, bearish below pivot $81.93, despite potential support at $80.67 and lower. In this article: Natural Gas -0.40% […]
Feb 26, 2024
Gold managed to stay above the key $2000 level despite rising Treasury yields.
Feb 26, 2024
Economic indicators from Germany signaled a worsening economic backdrop.
Feb 26, 2024
Samsung unveils Galaxy Ring with health-tracking features, enters smart ring market.
Feb 26, 2024By Medha Singh and Lisa Pauline Mattackal
Jul 16, 2023
By Harry Robertson and Rae Wee LONDON/SINGAPORE (Reuters) – The dollar climbed to a one-month high against Japan’s yen on Monday as traders eyed up another interest rate hike from the Federal Reserve, while the Bank of Japan stuck to its easy money policies.
Apr 17, 2023
By Chris Prentice and John McCrank NEW YORK (Reuters) – The head of the U.S. Securities and Exchange Commission (SEC) plans to defend its rulemaking and policing of market misconduct at a Tuesday hearing led by Republican lawmakers who have accused it of overstepping its authority.
Apr 17, 2023