
Ethereum (ETH) has been on a rollercoaster ride over the past few months, with the cryptocurrency experiencing significant volatility across different time frames. Looking at the 120-day chart, we can see that ETH has been in a strong uptrend since late November 2023, with the price more than doubling from $2,027.58 to a high of $4,064.95 by March 11th, 2024. Interestingly, the Stochastic RSI oscillator provided some useful signals along the way, with oversold readings in late December and late January preceding price rallies, while overbought readings in mid-February and early March preceded pullbacks. The OBV indicator also trended higher alongside price, confirming the bullish trend. However, the sharp decline in March and weakening OBV suggest that the uptrend may be losing steam.
Summary:
Ethereum (ETH) has experienced significant volatility recently. The 120-day chart shows a strong uptrend since late November, with the price more than doubling, but signs of the uptrend losing steam. The 40-day chart reveals a rally from mid-February to early March, followed by a pullback finding support around $3,300. The 3-day chart indicates a potential near-term pullback or consolidation, with key resistance levels around $3,433 and $3,475. While the long-term trend appears bullish, the short-term outlook is somewhat bearish based on indicators. Investors should monitor price action around key Fibonacci levels to gauge the market’s directional bias.
Ethereum (ETH) has been on a rollercoaster ride over the past few months, with the cryptocurrency experiencing significant volatility across different time frames. Let’s dive into the technical analysis to see what the charts are telling us about ETH’s potential future price movements.
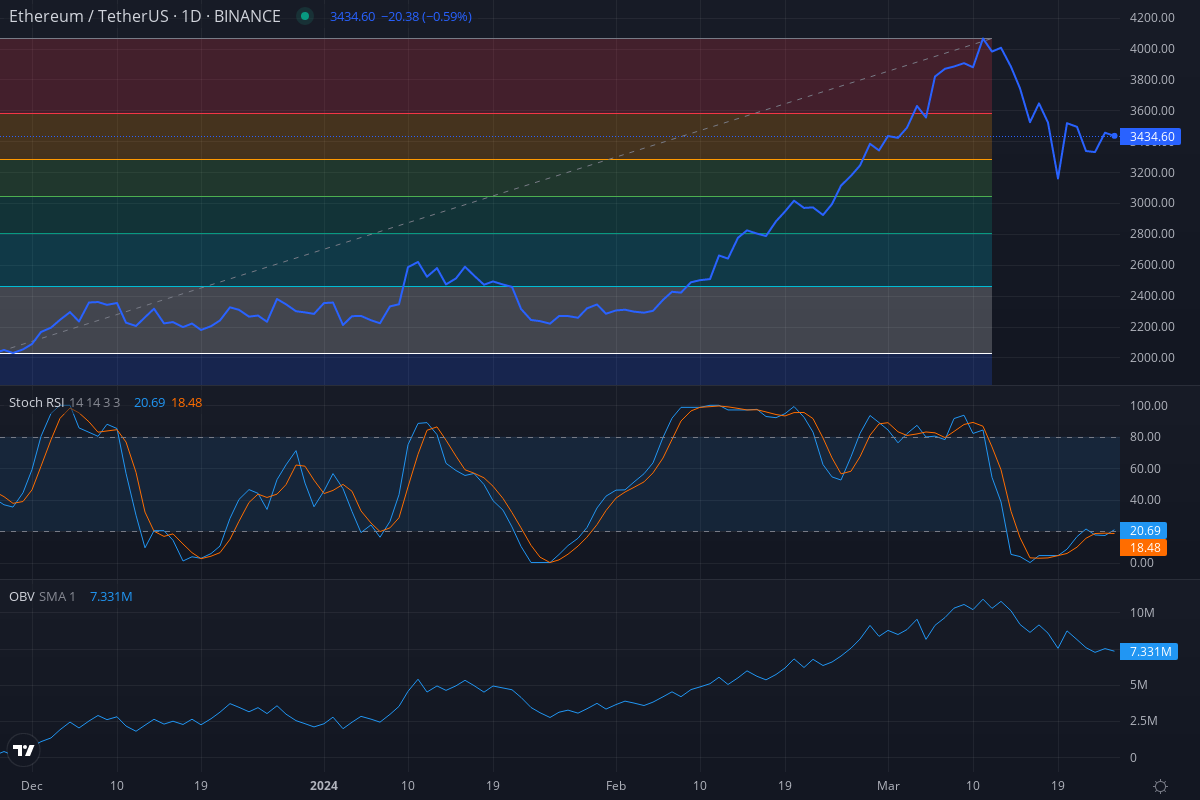
Looking at the 120-day chart, we can see that ETH has been in a strong uptrend since late November 2023, with the price more than doubling from $2,027.58 to a high of $4,064.95 by March 11th, 2024. Interestingly, the Stochastic RSI oscillator provided some useful signals along the way, with oversold readings in late December and late January preceding price rallies, while overbought readings in mid-February and early March preceded pullbacks.
The OBV indicator also trended higher alongside price, confirming the bullish trend. However, the sharp decline in March and weakening OBV suggest that the uptrend may be losing steam. Notably, the price found support near the 23.6% Fibonacci retracement level at $3,336.47 during the March decline. If ETH can hold above this key support level, the longer-term uptrend may remain intact. However, a sustained move below this level could signal a deeper correction on the horizon.
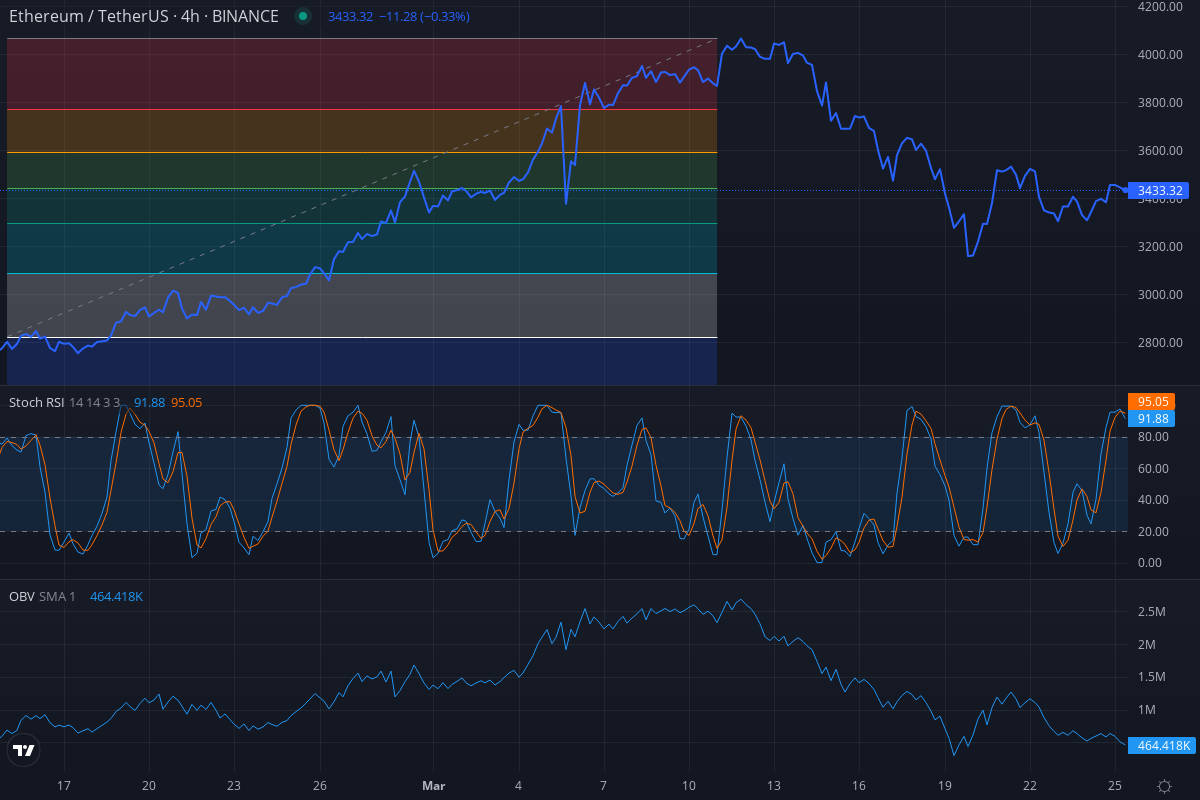
Zooming in to the 40-day chart, we can see the strong uptrend in more detail, with ETH rallying from $2,822.68 on February 15th to a high of $4,064.95 on March 11th. The price then pulled back, finding support around the $3,300 level in the second half of March. The Stochastic RSI bottomed near 0 on March 16th, coinciding with a local price low, but has stayed below the key 80 level, indicating that the uptrend may not be firmly reestablished yet.
The OBV indicator shows a steady rise from mid-February to early March, confirming the uptrend, but has pulled back with price while remaining well above its February levels. This suggests that overall buying pressure is still intact. Surprisingly, the 38.2% Fibonacci retracement level around $3,300 has provided strong support during the pullback. A sustained break below this level would suggest a deeper correction is unfolding.
For the bullish case to remain intact, ETH should ideally hold above the $3,300-$3,500 support zone. A breakout to new highs would signal the next leg up is underway. Conversely, a breakdown below support would warn of a potential trend change.
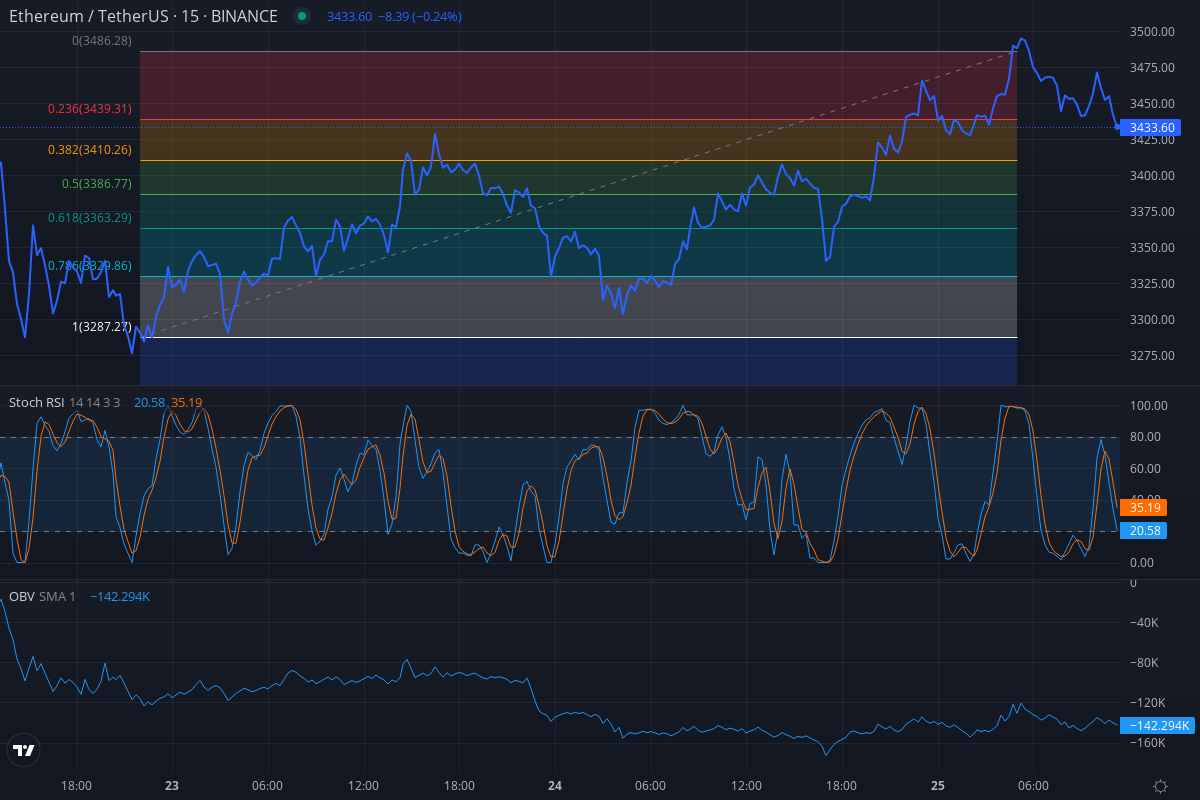
Finally, looking at the 3-day chart, we can see that ETH has been trading in a range between $3,287 and $3,489 over the past few days. The price did stage an impressive rally from $3,308 to $3,489 on March 24-25, but the Stochastic RSI suggests it may have been overextended. Prices were rejected at key Fibonacci resistance levels and OBV remains negative overall.
This points to a potential pullback or consolidation in the near-term, with $3,433 and $3,475 acting as key resistance levels to watch. A decisive break above $3,489 would be needed to signal a continuation of the uptrend. Conversely, a drop below the $3,287-$3,308 support zone would indicate further downside is likely.
In conclusion, while the long-term trend for ETH appears bullish, the short-term outlook is somewhat bearish based on the indicators. However, the March 24-25 rally shows that bulls are still active. More confirmation is needed before a clear direction can be determined. Investors should monitor price action around key Fibonacci levels to gauge the market’s directional bias going forward. Nimble traders can look to play the range between support and resistance until a breakout occurs. As always, risk management is crucial in this volatile market.
After graduating with an Accounting and Finance degree, Louis decided to combine his passion for Crypto and Writing, moving away from the path he expected to follow after graduating from University.
Full Bio
Solana (SOL) has been on a rollercoaster ride over the past few months, with the cryptocurrency experiencing significant volatility and price swings. Starting with the 120-day period from November 27th, 2023 to March 25th, 2024, SOL kicked off at $55.05 and embarked on a steady climb, reaching a local high of $120.90 on December 25th. […]
Nov 27, 2025
Ethereum (ETH) has been on a rollercoaster ride over the past few months, with the cryptocurrency experiencing significant volatility across different time frames. Looking at the 120-day chart, we can see that ETH has been in a strong uptrend since late November 2023, with the price more than doubling from $2,027.58 to a high of […]
Mar 25, 2024
Bitcoin’s price action over the last 120 days has been a rollercoaster ride for investors. Starting around $37,000 in late November 2023, the price rallied strongly, nearly doubling to reach a high around $73,000 in early February 2024. However, after this impressive run, the price began to lose steam, retracing to around $50,000 by late […]
Mar 25, 2024
In the last few months, Solana (SOL) has demonstrated a volatile yet upward trajectory, breaking through resistance levels and occasionally falling back to test support within designated ranges. Notably, the asset showcased significant price movements and trading volumes, indicating strong buying and selling pressures at various points. The recent analysis reveals a bullish momentum, with […]
Feb 29, 2024
In the ever-evolving landscape of cryptocurrency markets, Ripple (XRP) has showcased a remarkable journey of resilience amidst volatility. Over the last 120 days, Ripple’s price has navigated through significant fluctuations, breaking above resistance levels and dipping below support levels, with trading volumes closely mirroring these pivotal movements. The recent analysis reveals a dynamic interplay between […]
Feb 29, 2024
In a remarkable journey over the last 120 days, Ethereum has showcased a bullish trend, breaking through multiple resistance levels with significant volume spikes. The recent analysis reveals Ethereum’s dynamic price movements, from struggling below the green range to soaring above the orange range, marking a peak at $3374.17. This upward trajectory is supported by […]
Feb 29, 2024
in the latest price analysis, Bitcoin (BTC) has shown an impressive surge, breaking through multiple resistance levels with significant trading volumes backing each move. Starting from a modest $35,421.4 in November 2023, BTC has climbed to a staggering $63,690.1 by February 2024. This journey was marked by a series of bullish breakouts, each supported by […]
Feb 29, 2024
Over the past 120 days, Bitcoin has shown remarkable volatility and resilience, climbing from $34,000 to over $52,000, supported by bullish moving averages.
Feb 26, 2024
Key Points: Strengthened dollar and high U.S. inflation fears prompt oil price decline, complicating rate cut expectations. Natural Gas surges 5.65% to $1.7760, bullish above pivot point $1.7333, with resistance up to $1.9291. UK Oil dips to $81.30, bearish below pivot $81.93, despite potential support at $80.67 and lower. In this article: Natural Gas -0.40% […]
Feb 26, 2024
Gold managed to stay above the key $2000 level despite rising Treasury yields.
Feb 26, 2024
Economic indicators from Germany signaled a worsening economic backdrop.
Feb 26, 2024
Samsung unveils Galaxy Ring with health-tracking features, enters smart ring market.
Feb 26, 2024By Medha Singh and Lisa Pauline Mattackal
Jul 16, 2023
By Harry Robertson and Rae Wee LONDON/SINGAPORE (Reuters) – The dollar climbed to a one-month high against Japan’s yen on Monday as traders eyed up another interest rate hike from the Federal Reserve, while the Bank of Japan stuck to its easy money policies.
Apr 17, 2023
By Chris Prentice and John McCrank NEW YORK (Reuters) – The head of the U.S. Securities and Exchange Commission (SEC) plans to defend its rulemaking and policing of market misconduct at a Tuesday hearing led by Republican lawmakers who have accused it of overstepping its authority.
Apr 17, 2023