
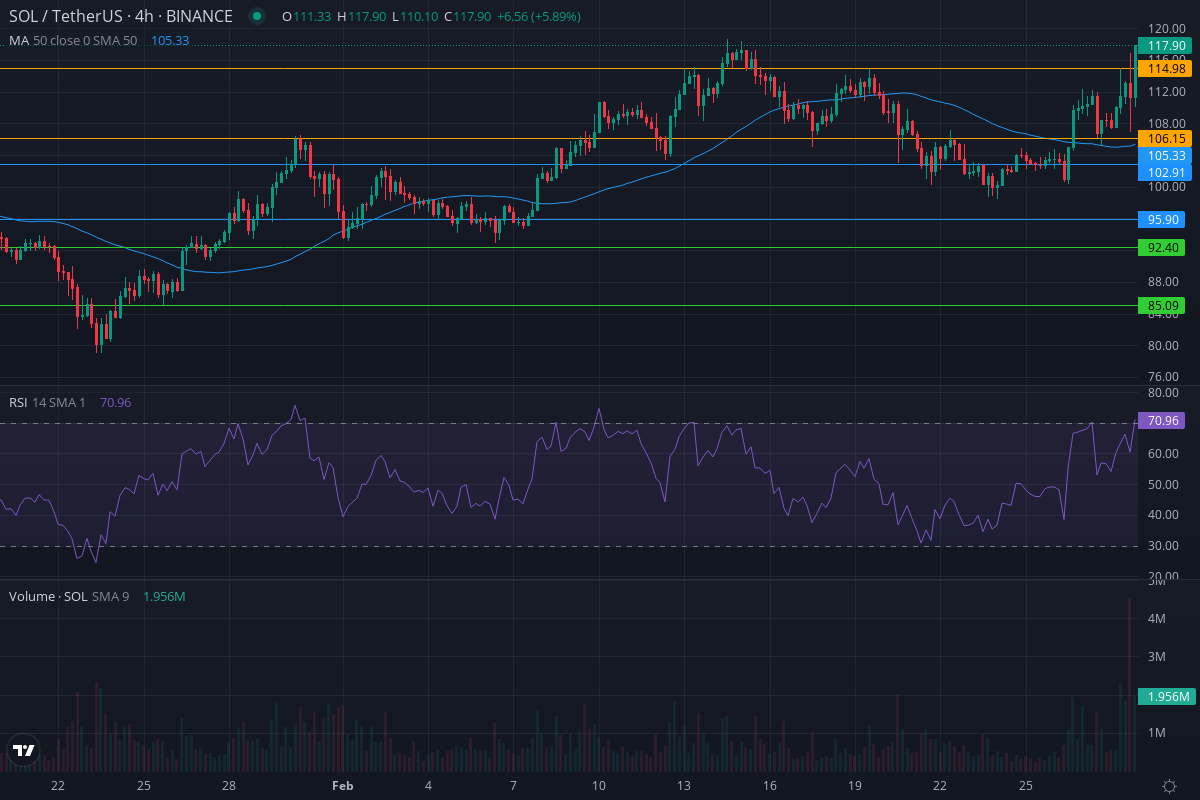
In the last few months, Solana (SOL) has demonstrated a volatile yet upward trajectory, breaking through resistance levels and occasionally falling back to test support within designated ranges. Notably, the asset showcased significant price movements and trading volumes, indicating strong buying and selling pressures at various points. The recent analysis reveals a bullish momentum, with the RSI currently standing at 70.96, suggesting that Solana might be entering overbought territory. This analysis aims to dissect Solana’s price action over different time frames, providing insights into its potential future movements.
Solana’s journey over the past 120 days has been nothing short of a rollercoaster, marked by significant price movements and volume changes. Starting in November 2023, Solana traded below the green range at $41.15, gradually climbing into the blue range by December, showcasing a strong buying interest. The asset peaked at $112.45 in December, indicating peak interest in Solana. However, it experienced a dramatic drop in January 2024, falling to $91.09, before making a notable recovery.
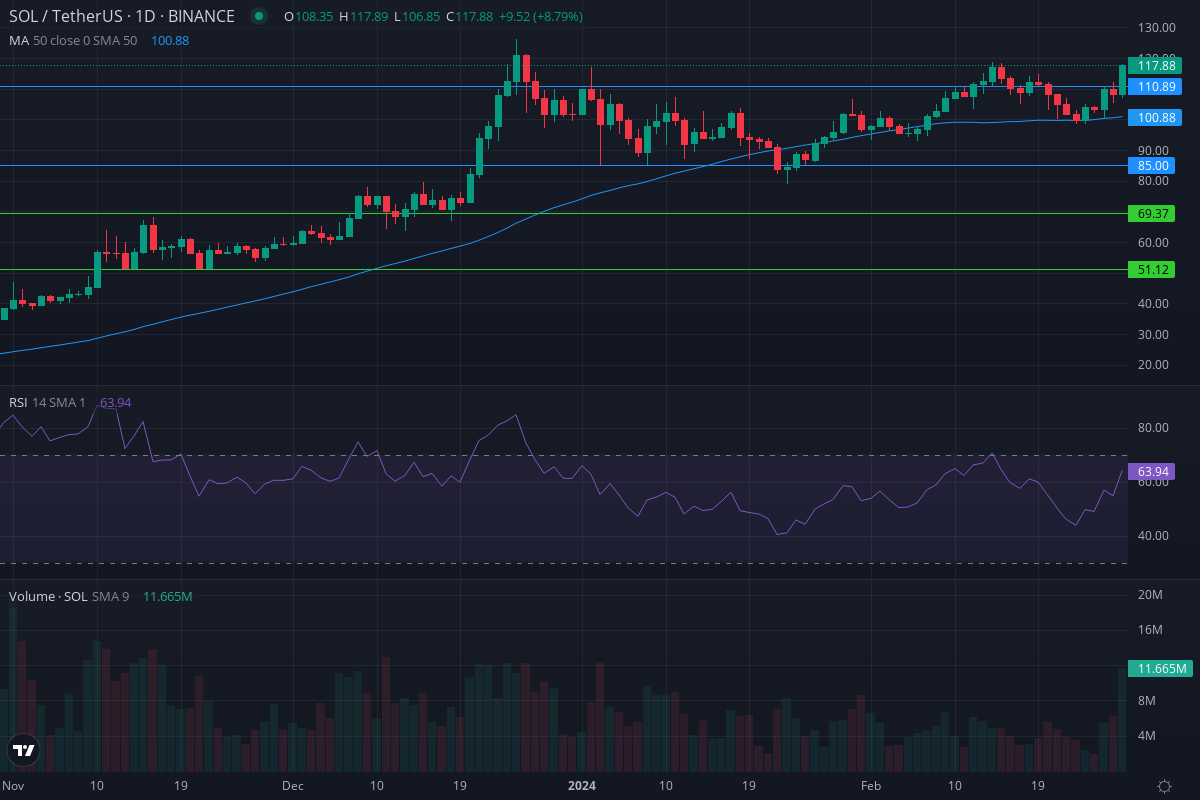
In conclusion, Solana’s recent performance showcases its volatility and the significant impact of trading volumes on its price movements. While the current bullish momentum is strong, investors should be cautious of potential overbought conditions. Stay updated with our future analyses to navigate the ever-changing landscape of cryptocurrency markets. Your thoughts on Solana’s future performance are welcome in the comments section below.
After graduating with an Accounting and Finance degree, Louis decided to combine his passion for Crypto and Writing, moving away from the path he expected to follow after graduating from University.
Full Bio
Solana (SOL) has been on a rollercoaster ride over the past few months, with the cryptocurrency experiencing significant volatility and price swings. Starting with the 120-day period from November 27th, 2023 to March 25th, 2024, SOL kicked off at $55.05 and embarked on a steady climb, reaching a local high of $120.90 on December 25th. […]
Nov 27, 2025
Ethereum (ETH) has been on a rollercoaster ride over the past few months, with the cryptocurrency experiencing significant volatility across different time frames. Looking at the 120-day chart, we can see that ETH has been in a strong uptrend since late November 2023, with the price more than doubling from $2,027.58 to a high of […]
Mar 25, 2024
Bitcoin’s price action over the last 120 days has been a rollercoaster ride for investors. Starting around $37,000 in late November 2023, the price rallied strongly, nearly doubling to reach a high around $73,000 in early February 2024. However, after this impressive run, the price began to lose steam, retracing to around $50,000 by late […]
Mar 25, 2024
In the last few months, Solana (SOL) has demonstrated a volatile yet upward trajectory, breaking through resistance levels and occasionally falling back to test support within designated ranges. Notably, the asset showcased significant price movements and trading volumes, indicating strong buying and selling pressures at various points. The recent analysis reveals a bullish momentum, with […]
Feb 29, 2024
In the ever-evolving landscape of cryptocurrency markets, Ripple (XRP) has showcased a remarkable journey of resilience amidst volatility. Over the last 120 days, Ripple’s price has navigated through significant fluctuations, breaking above resistance levels and dipping below support levels, with trading volumes closely mirroring these pivotal movements. The recent analysis reveals a dynamic interplay between […]
Feb 29, 2024
In a remarkable journey over the last 120 days, Ethereum has showcased a bullish trend, breaking through multiple resistance levels with significant volume spikes. The recent analysis reveals Ethereum’s dynamic price movements, from struggling below the green range to soaring above the orange range, marking a peak at $3374.17. This upward trajectory is supported by […]
Feb 29, 2024
in the latest price analysis, Bitcoin (BTC) has shown an impressive surge, breaking through multiple resistance levels with significant trading volumes backing each move. Starting from a modest $35,421.4 in November 2023, BTC has climbed to a staggering $63,690.1 by February 2024. This journey was marked by a series of bullish breakouts, each supported by […]
Feb 29, 2024
Over the past 120 days, Bitcoin has shown remarkable volatility and resilience, climbing from $34,000 to over $52,000, supported by bullish moving averages.
Feb 26, 2024
Key Points: Strengthened dollar and high U.S. inflation fears prompt oil price decline, complicating rate cut expectations. Natural Gas surges 5.65% to $1.7760, bullish above pivot point $1.7333, with resistance up to $1.9291. UK Oil dips to $81.30, bearish below pivot $81.93, despite potential support at $80.67 and lower. In this article: Natural Gas -0.40% […]
Feb 26, 2024
Gold managed to stay above the key $2000 level despite rising Treasury yields.
Feb 26, 2024
Economic indicators from Germany signaled a worsening economic backdrop.
Feb 26, 2024
Samsung unveils Galaxy Ring with health-tracking features, enters smart ring market.
Feb 26, 2024By Medha Singh and Lisa Pauline Mattackal
Jul 16, 2023
By Harry Robertson and Rae Wee LONDON/SINGAPORE (Reuters) – The dollar climbed to a one-month high against Japan’s yen on Monday as traders eyed up another interest rate hike from the Federal Reserve, while the Bank of Japan stuck to its easy money policies.
Apr 17, 2023
By Chris Prentice and John McCrank NEW YORK (Reuters) – The head of the U.S. Securities and Exchange Commission (SEC) plans to defend its rulemaking and policing of market misconduct at a Tuesday hearing led by Republican lawmakers who have accused it of overstepping its authority.
Apr 17, 2023